Market Commentary | November 18th, 2024
Week in Review…
Markets retreated last week as investors reassessed potential tariff implications as well as concerns around inflation reaccelerating.
- The S&P 500 fell 2.08%, ending a multi-week positive streak
- The Dow Jones Industrial Average was down 1.24%
- The Nasdaq finished the weakest, down 3.15%
- The 10-Year Treasury yield ended the week at 4.45%

This past week’s economic data centered around inflation with Consumer Price Index (CPI) data for October having been released. Core CPI remained unchanged at 0.3% month-over-month (MoM), in line with expectations. Headline CPI also held steady at 0.2% MoM and rose to 2.6% year-over-year (YoY). Investors paid close attention to these rates as concerns of possible reinflation have started to worry some market participants, which could limit the Fed’s rate cut regime. However, steady core CPI suggests underlying inflation pressures remain stable, providing some mild reassurance to investors.
Thursday, we received Producer Price Index (PPI) data which increased by 0.2% MoM, matching expectations. Crude oil inventories rose by 2.1 million barrels, reflecting ongoing market adjustments following geopolitical tensions. Additionally, Fed Chairman Powell spoke on Thursday, emphasizing that the economy is not signaling a need to rush interest rate cuts. Powell’s cautious stance on rate cuts indicates the Fed’s focus on sustaining economic stability amid mixed signals from inflation data.
Finally, we finished the week with retail sales numbers for October, which showed a 0.74% MoM increase and a 4.13% YoY rise. Core retail sales also saw a modest gain of 0.3% MoM. The robust retail sales figures suggest consumer spending remains resilient as we head into the holiday season, potentially boosting economic growth.
Spotlight

A Relook at the 60/40 Portfolio
The 60/40 was once the gold standard of portfolio allocation. Over the past few years, we have seen this standard challenged by rising inflation and dominance in U.S. equities. Why has this changed and what can be learned?
The Rise
The 60/40 portfolio is a portfolio that consists of a 60% equity allocation and a 40% bond allocation and has its roots stretching back to Harry Markowitz and modern portfolio theory. The crux of the theory rests on the idea that diversification is a desirable feature in constructing a portfolio. In the same way, the 60/40 rests on the idea of diversification of asset classes.
The 60/40 portfolio has become more than a theory, and over the past 70 to 80 years, essentially became the gold standard of investment allocation. Below is a chart for return, risk, and efficiency ratios from January 1, 1981 to October 31, 2024, for a hypothetical 60/40 portfolio (all numbers have been annualized):


Despite portfolio returns that lagged stock returns, the beauty of the portfolio was the efficient use of risk. The 60/40 portfolio was able to capture more excess return per unit of risk taken. This was made possible in part because the correlation between stocks and bonds remained negative throughout that period. Meaning, the combined risk of the portfolio was less than the sum of its parts.
What made the strategy even more impressive was its simplicity and how it was tailored to investor’s biases. The 60/40 neither requires active management nor access to exclusive funds. The strategy was simple, liquid, and built to suffer shallower drawdown (periods of loss) to prevent panic selling. The market had found a simple but powerful tool to help harness the benefits of diversification. However, no tool is suitable for every situation.
The Fall from Grace
2022 was more than simply a bad year; for the 60/40 portfolio, it was a bit of an identity crisis. Both U.S. equities and U.S. Treasuries suffered significant drawdowns. Bonds did not serve as a ballast for equity losses that year. As a result, the 60/40 portfolio suffered its worst performance since 1937, declining 17.5%, the fourth worst performance in the last 200 years.1 The portfolio was built on the principles of diversification and risk efficiency. Perhaps the 60/40 portfolio had outlived its utility?
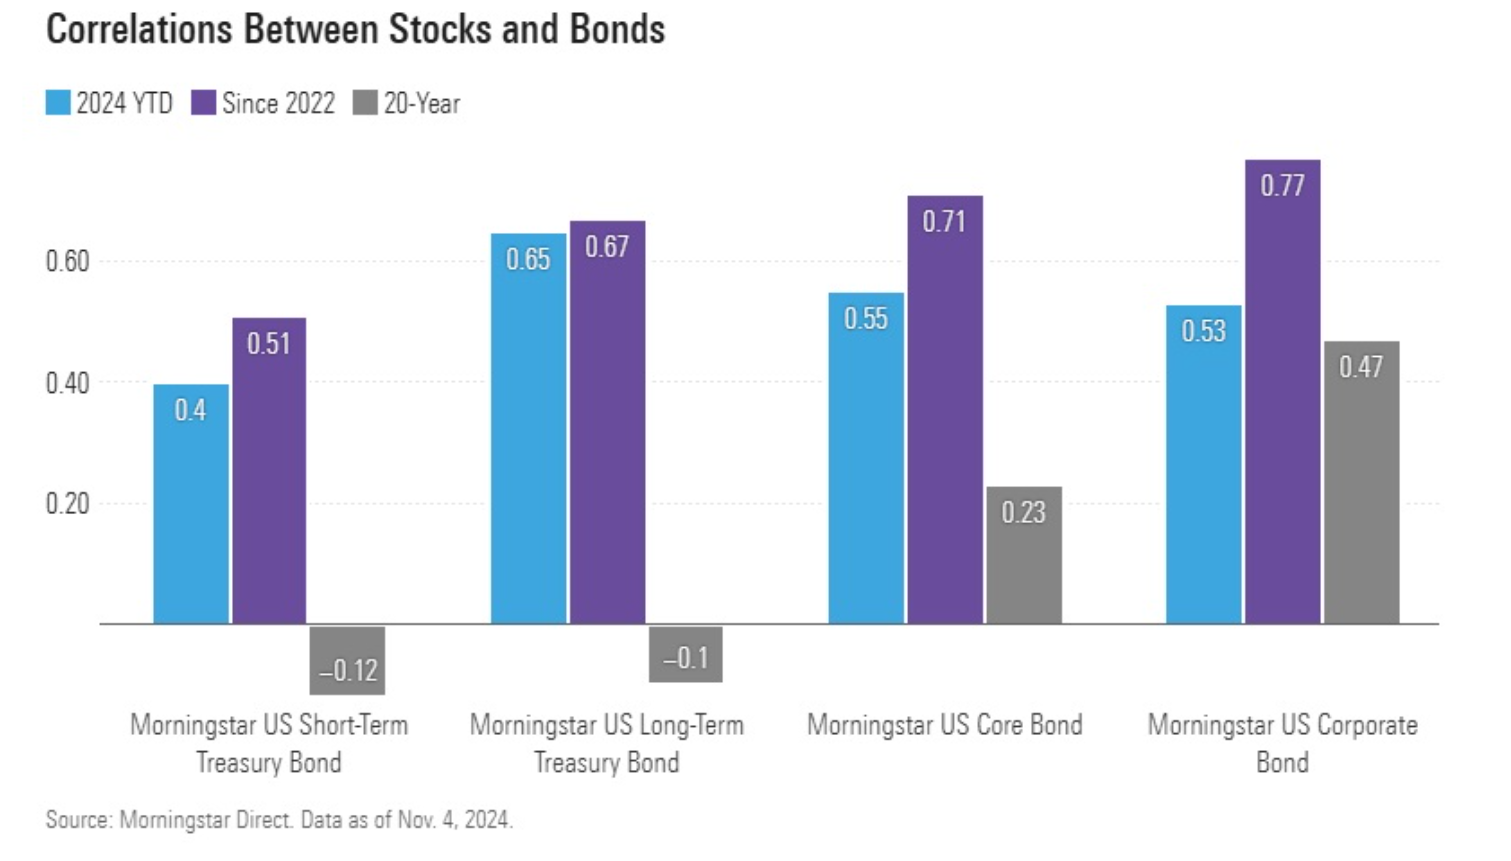
As it turns out, 2022 was a “perfect storm” of economic factors like highest inflation levels in 40 years and a Central Bank that raised interest rates 11 times to combat this inflation.2 In essence, the confluence of strong economic headwinds showed investors that the 60/40 is not bulletproof. The portfolio relies heavily on the correlation between stocks and bonds and correlations change over time. The graph below illustrates these changing correlations:

The academic term for the chart above is regime change, but this is basically a fancy term for “things don’t stay the same.” This statement is true for correlations as well. Correlations are not static. This can become problematic when portfolio allocations are built around a negative correlation between stocks and bonds that is no longer true. That is what happened in 2022. Investors are not terribly concerned about assets appreciating in unison, but they become concerned when assets begin falling together in unison. Both bonds and stocks lost money at the same time. Not surprisingly, investors began to question how viable the 60/40 portfolio would be going forward.
The Prodigal Son Returns?
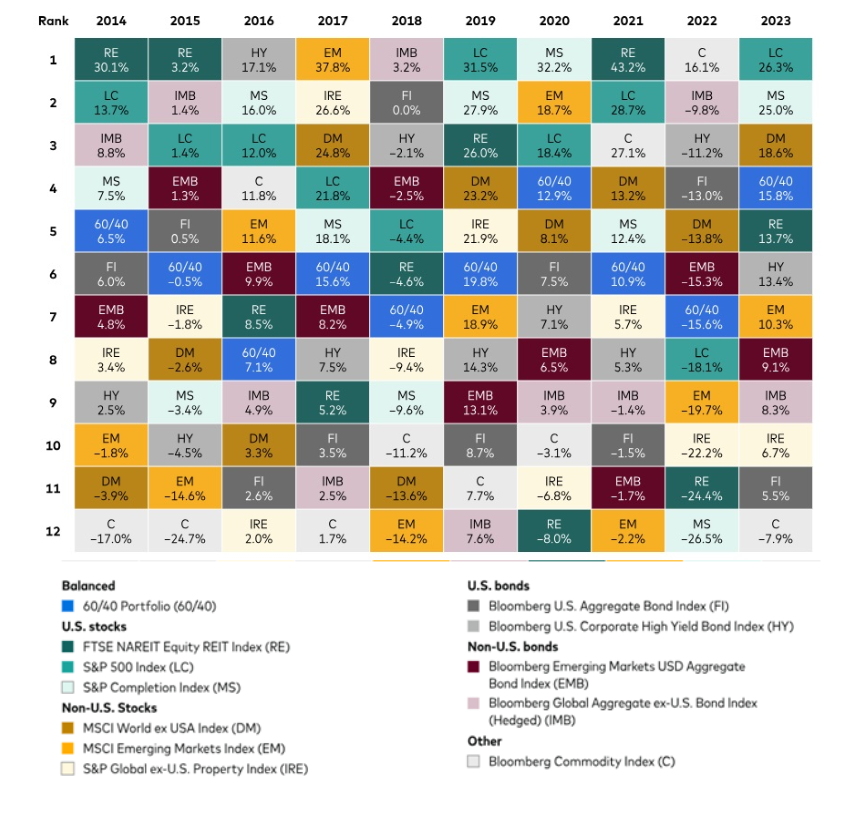
The strategy will remain relevant because it is built on a fundamental tenet of finance: diversification. In short, the 60/40 portfolio is not dead because diversification is not dead. The below graph provides a reference for how diversification is helpful in smoothing out the volatility of asset class returns.


Recent history shows that the 60/40 portfolio can be very sensitive to the change in correlation between stocks and bonds. For example, the chart below shows how changes in the stock/bond correlation are influenced by different inflation regimes. Meaning, historical correlations may not be as stable as they appeared. Consequently, a 60/40 portfolio might not be your entire portfolio, but rather, a core position with supplemental assets to help reap further diversification benefits. In that sense, perhaps the 60/40 portfolio didn’t die, but expanded upon its core tenant of diversification.

The 60/40 portfolio provides a wonderful example of how constructing a portfolio is less about how well assets perform individually, but rather, how assets and asset classes interact with each other. The next time you look to add or subtract a position to your portfolio consider how the current and proposed positions move in relation to the other assets.
Week Ahead…

Next week is expected to be relatively quiet in terms of economic data releases. On Tuesday, the market will see new data on housing starts and building permits. Housing starts have shown some improvement, reaching a five-month high in the previous month, while building permits posted a slight increase. However, economists caution that residential investment will likely continue to weigh on gross domestic product (GDP) growth.
On Thursday, the weekly jobless claims report will be released, continuing to serve as a leading indicator for the labor market’s health. Recent disruptions from hurricanes and ongoing labor disputes led to a temporary rise in jobless claims last month, and these impacts will likely linger into next week’s report, potentially inflating the jobless numbers. While the figures may appear elevated due to these external factors, they’re unlikely to signal underlying weakness in the labor market. The temporary rise in unemployment claims from the recent disruptions isn’t expected to prompt faster rate cuts, as the broader labor market remains relatively resilient. Unless there are signs of sustained weakness, the Fed is likely to stay cautious in its approach, keeping a close eye on economic data over the coming months before making significant policy adjustments.
Additionally, next week will bring the latest consumer sentiment data from the University of Michigan. This sentiment index has shown steady improvement over the past four months, with last month’s reading sitting 50% above its level in June 2022. However, despite this upward trend, sentiment remains below pre-pandemic levels. Next week’s release will also be the first to capture sentiment following the recent election, providing insight into how the results may influence consumer confidence. It will be interesting to see whether the election outcomes further boost sentiment or if concerns over economic and policy uncertainties temper consumer outlooks.
1 Kandhari, Jitania. “Big Picture: Return of the 60/40. https://www.morganstanley.com/im/publication/insights/articles/article_bigpicturereturnofthe6040_ltr.pdf.
2 Thornburg Investment Management®. “Revisiting the 60-40 Portfolio.” Thornburg Investment Management, November 28, 2023. Accessed November 14, 2024. https://www.thornburg.com/article/revisiting-the-60-40-portfolio/.
3 Albrecht, Bella. “‘Diversification Is Back’—Why 60/40 Portfolios Are Working.” Morningstar, Inc., November 8, 2024. Accessed November 14, 2024. https://www.morningstar.com/markets/diversification-is-backwhy-6040-portfolios-are-working.
4 Vanguard. “The Global 60/40 Portfolio: Steady as It Goes,” October 22, 2024. Accessed November 14, 2024. https://corporate.vanguard.com/content/corporatesite/us/en/corp/articles/global-60-40-portfolio-steady-as-it-goes.html#:~:text=Fast%20forward%20to%20September%202024,return%20since%20year%2Dend%202022.&text
=Even%20accounting%20for%202022%2C%20the,above%20its%20long%2Dterm%20average.
5 Godbersen, Soren. “The 60/40 Portfolio: Why the Classic Model Faces Challenges, and How to Go Beyond.” EquityMultiple, November 10, 2024. Accessed November 15, 2024. https://equitymultiple.com/blog/60-40-portfolio.
This content was developed by Cambridge from sources believed to be reliable. This content is provided for informational purposes only and should not be construed or acted upon as individualized investment advice. It should not be considered a recommendation or solicitation. Information is subject to change. Any forward-looking statements are based on assumptions, may not materialize, and are subject to revision without notice. The information in this material is not intended as tax or legal advice.
Investing involves risk. Depending on the different types of investments there may be varying degrees of risk. Socially responsible investing does not guarantee any amount of success. Clients and prospective clients should be prepared to bear investment loss including loss of original principal. Indices mentioned are unmanaged and cannot be invested into directly. Past performance is not a guarantee of future results.
The Dow Jones Industrial Average (DJIA) is a price-weighted index composed of 30 widely traded blue-chip U.S. common stocks. The S&P 500 is a market-cap weighted index composed of the common stocks of 500 leading companies in leading industries of the U.S. economy. The NASDAQ Composite Index is a market-value weighted index of all common stocks listed on the NASDAQ stock exchange.
