Weekly Market Commentary | October 7th, 2024
Week in Review…
The financial markets continue to adjust their views on interest rates and inflation, with all major indices posting positive results, and the 10-Year Treasury rising 18 basis points (bps).
- The S&P 500 rose 0.22%
- The Dow Jones Industrial Average climbed 0.09%
- The Nasdaq finished the week up 0.10%
- The 10-Year Treasury yield ended the week at 3.98%

Starting the week, Federal Reserve (Fed) Chair Jerome Powell emphasized that the economy is in solid shape and the Fed has made significant progress over the past two years toward achieving their dual-mandate goals of maximum employment and stable prices. The Fed, however, does not think the current state of the economy warrants cutting rates quickly, but will continue to reduce interest rates from a two-decade high while taking a data-dependent approach.
The Fed’s view on the speed of interest rate cuts was reaffirmed by the labor market. The market was surprised by both the Job Openings and Labor Turnover Survey (JOLTS) report and the nonfarm payrolls report. The JOLTS report on Tuesday showed that U.S. job openings unexpectedly increased in August after two straight months of decreases. Still, hiring was soft and consistent with a slowing labor market; there were 1.13 job openings for every unemployed person in August compared to 1.08 in July. Friday’s non-farm report showed that job growth accelerated sharply in September, and the unemployment rate ticked lower. Employers added 254,000 jobs last month, significantly more than the 150,000 expected. The unemployment rate declined to 4.1% as a result.
Producer and Services Purchasing Managers’ Index (PMI) was also released during the week. Manufacturing PMI in September remained in contraction at 47.2%, matching the figure recorded in August. The weakening continues to be driven by demand, as companies have shown an unwillingness to invest in capital and inventory with uncertainty in the economy. Services PMI improved in September, registering 54.9% – 3.4% higher than August and the highest reading since February 2023.
Spotlight

Third Quarter Equity
and Fixed Income Review
As we begin the fourth quarter, we take a closer look back at the third quarter to see what happened from a broad view in equity and fixed income markets.
Equity Review
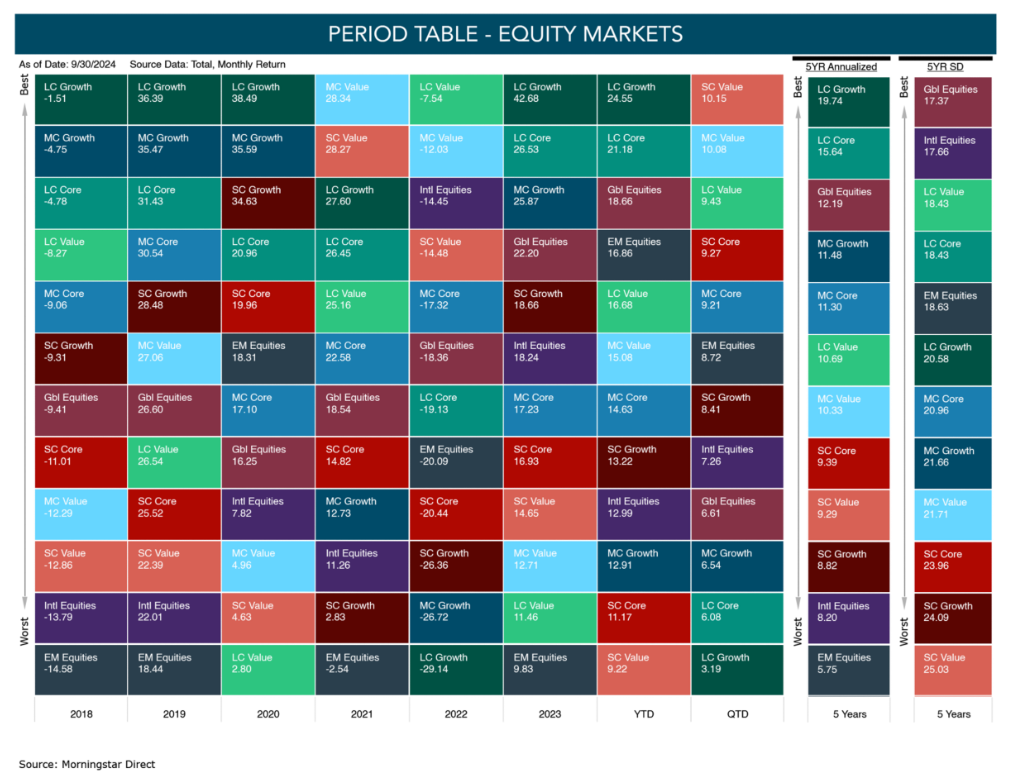
In the third quarter, we saw a reversal of the first two quarters. Small cap U.S. equities outperformed all, as the Russell 2000 returned 9.3%, outperforming the large cap Russell 1000 by 3.2% (6.1%). In non-U.S. equities, emerging markets outperformed developed markets, while international as a whole outperformed. Value outperformed growth, with the Russell 1000 Value returning 9.43% versus 3.19% for the Russell 1000 Growth.


Sector Review
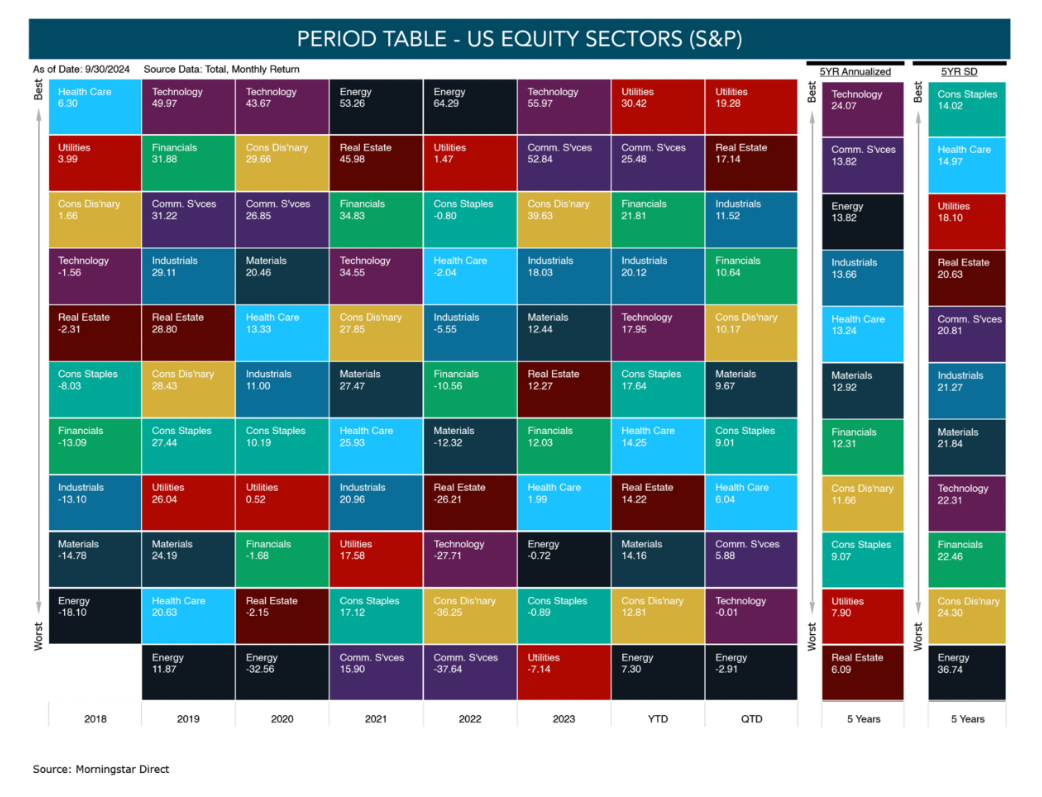
Utilities continued to lead year-to-date (YTD), with the strongest return of all the eleven S&P sectors, with a quarterly return of 19.28% and YTD return of 30.42%. Energy continued to lag, with a decline of -2.91% for the quarter and the lowest sector return for the year of 7.30%. Technology was the only other sector to not have a positive return for the quarter, albeit the sector was relatively flat (-0.01%). The other surprising sector was Real Estate (specifically, public Real Estate Investment Trusts, or REITs) which rebounded this quarter on improvements in vacancies and interest rates.

Fixed Income Review
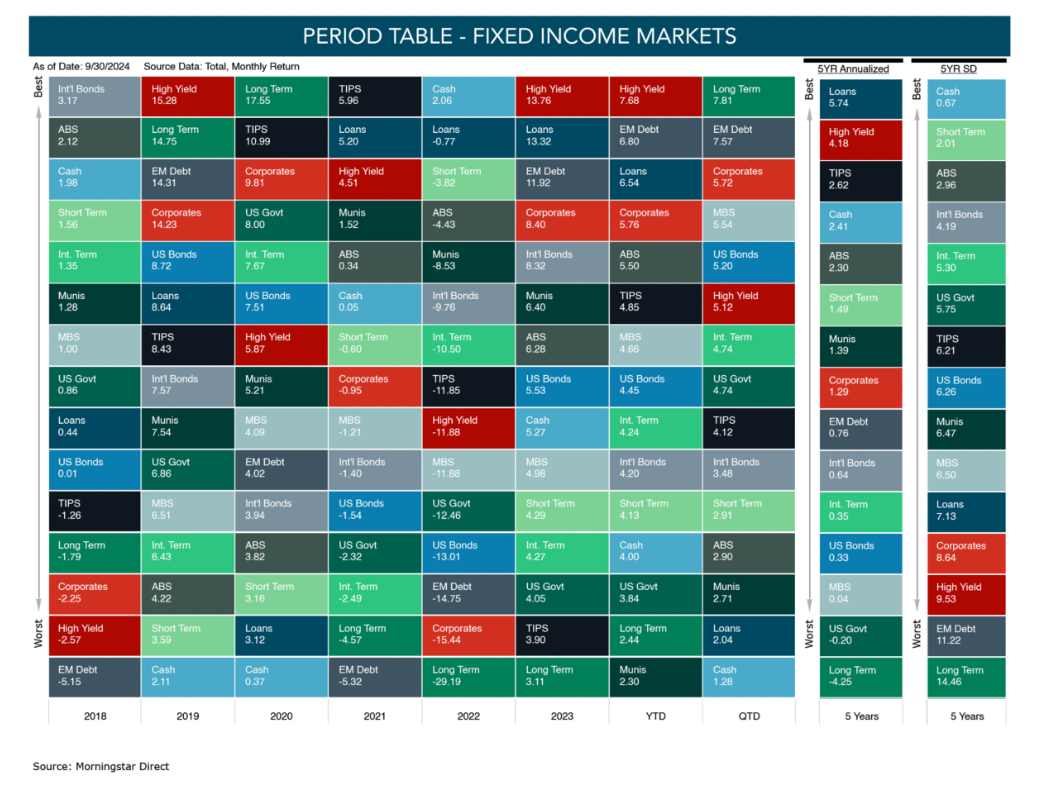
With the Fed cutting rates for the first time since 2020, long-term bonds rallied in the third quarter, returning 7.81%. Correspondingly, cash was the worst performer, returning 1.28% and ending up 4% year to date. In spread sectors, emerging market debt led all spread sectors with 7.57%, trailing only high-yield bonds YTD with a return of 6.80%. Loans reversed their dominance with only a 2.04% gain for the quarter – they are still the top performer over the trailing five years.

Week Ahead…

As the Fed’s cutting cycle begins, Chair Jerome Powell’s recent speech emphasized that the Fed is in no rush to cut rates aggressively. Powell highlighted that while inflation is easing, the Fed will remain cautious, moving forward with gradual adjustments based on incoming data.
As a result, the market’s attention will remain on key economic indicators next week, particularly the Consumer Price Index (CPI) and Producer Price Index (PPI) reports. Though inflation has slowed significantly, any unexpected increase could unsettle the markets, making these reports crucial for the Fed’s policy trajectory.
Another significant release next week will be the University of Michigan’s Consumer Sentiment report. Consumer sentiment has been rising steadily in recent months, with the latest readings showing positive momentum. However, concerns surrounding the upcoming U.S. elections and ongoing geopolitical tensions may start to weigh on consumer confidence. While optimism remains strong, these external factors could introduce caution, especially if they create uncertainties for households and businesses. The markets will be closely watching these data points to get a clearer sense of how inflation and sentiment will shape the economy going into the year-end.
Legend, Category, Market Index
LC Growth, Large Cap Growth, Russell 1000 Growth TR USD
Measures the performance of the large-cap growth segment of the U.S. equity universe. It includes those Russell 1000 Index companies with higher price-to-book ratios and higher forecasted growth values.
LC Core, Large Cap Core, Russell 10000 TR USD
Measures the performance of the large-cap value segment of the U.S. equity universe. It includes those Russell 1000 Index companies with lower price-to-book ratios and lower expected growth values.
LC Value, Large Cap Value, Russell 1000 Value TR USD
Measures the performance of the large-cap value segment of the U.S. equity universe. It includes those Russell 1000 Index companies with lower price-to-book ratios and lower expected growth values.
MC Growth, Mid Cap Growth, Russell Midcap Growth TR USD
Measures the performance of the mid-cap segment of the U.S. equity universe, represents approximately 31% of the total market capitalization and includes approximately 800 of the smaller securities.
MC Core, Mid Cap Core, Russell Midcap Value TR USD
Measures the performance of the mid-cap segment of the U.S. equity universe, represents approximately 31% of the total market capitalization and includes approximately 800 of the smaller securities.
MC Value, Mid Cap Value, Russell Midcap Value TR USD
Measures the performance of small-cap value segment of the U.S equity universe. It includes those Russell Midcap Index companies with lower price-to-book ratios and lower forecasted growth values.
SC Growth, Small Cap Growth, Russell 2000 Growth TR USD
Measures the performance of the small-cap growth segment of the U.S. equity universe. It includes those Russell 2000 Index companies with higher price-to-value ratios and higher forecasted growth values.
SC Core, Small Cap Core, Russell 2000 TR USD
Measures the performance of small-cap value segment of the U.S. equity universe, represents approximately 10% of the total market capitalization and includes approximately 2000 of the smallest securities.
SC Value, Small Cap Value, Russell 2000 Value TR USD
Measures the performance of small-cap value segment of the U.S. equity universe. It includes those Russell 2000 Index companies with lower price-to-book ratios and lower forecasted growth values.
Glbl. Equities, Gloabal Equities, MSCI All Country Weighted Index (ACWI) NR USD
A free float-adjusted market capitalization weighted index that measures the equity market performance of developed and emerging markets. It consists of 44 country indices comprising 23 developed and 21 emerging market country indices.
Intl. Equities, Development Internation Equities, MSCI EAFE NR USD
Measures the performance of the development equity markets of Europe, Australasia and the Far East.
EM Equities, Emerging Market Equities, MSCI EM NR USD
Measures the performance of emerging equity markets.
Market Index Series
S&P US Equity Sectors, US Equity Sectors, S&P US Equity Sector Series
The S&P U.S. Select Sector indices are designed to reflect the U.S. equity markets and, through the markets, the U.S. economy.
The Select Sector Indices follow a modified market capitalization weight methodology. All components of the S&P 500® are assigned to at least one of 10 Select Sector Indices, which seek to track major economic segments and are highly liquid benchmarks. Stock classifications are based on the Global Industry Classification Standard (GICS®).
There are 11 GICS sectors in the S&P 500:
- Information Technology (Legend – Technology)
- Health Care
- Financials
- Consumer Discretionary (Legend – Cons. Dis’nary)
- Communication Services (Legend – Comm. S’ves)
- Industrials
- Consumer Staples (Legend – Cons. Staples)
- Energy
- Utilities
- Rel Estate
- Materials
This content was developed by Cambridge from sources believed to be reliable. This content is provided for informational purposes only and should not be construed or acted upon as individualized investment advice. It should not be considered a recommendation or solicitation. Information is subject to change. Any forward-looking statements are based on assumptions, may not materialize, and are subject to revision without notice. The information in this material is not intended as tax or legal advice.
Investing involves risk. Depending on the different types of investments there may be varying degrees of risk. Socially responsible investing does not guarantee any amount of success. Clients and prospective clients should be prepared to bear investment loss including loss of original principal. Indices mentioned are unmanaged and cannot be invested into directly. Past performance is not a guarantee of future results.
The Dow Jones Industrial Average (DJIA) is a price-weighted index composed of 30 widely traded blue-chip U.S. common stocks. The S&P 500 is a market-cap weighted index composed of the common stocks of 500 leading companies in leading industries of the U.S. economy. The NASDAQ Composite Index is a market-value weighted index of all common stocks listed on the NASDAQ stock exchange.
